
🛣️ Landing board heatmap generation
🎯 Purpose
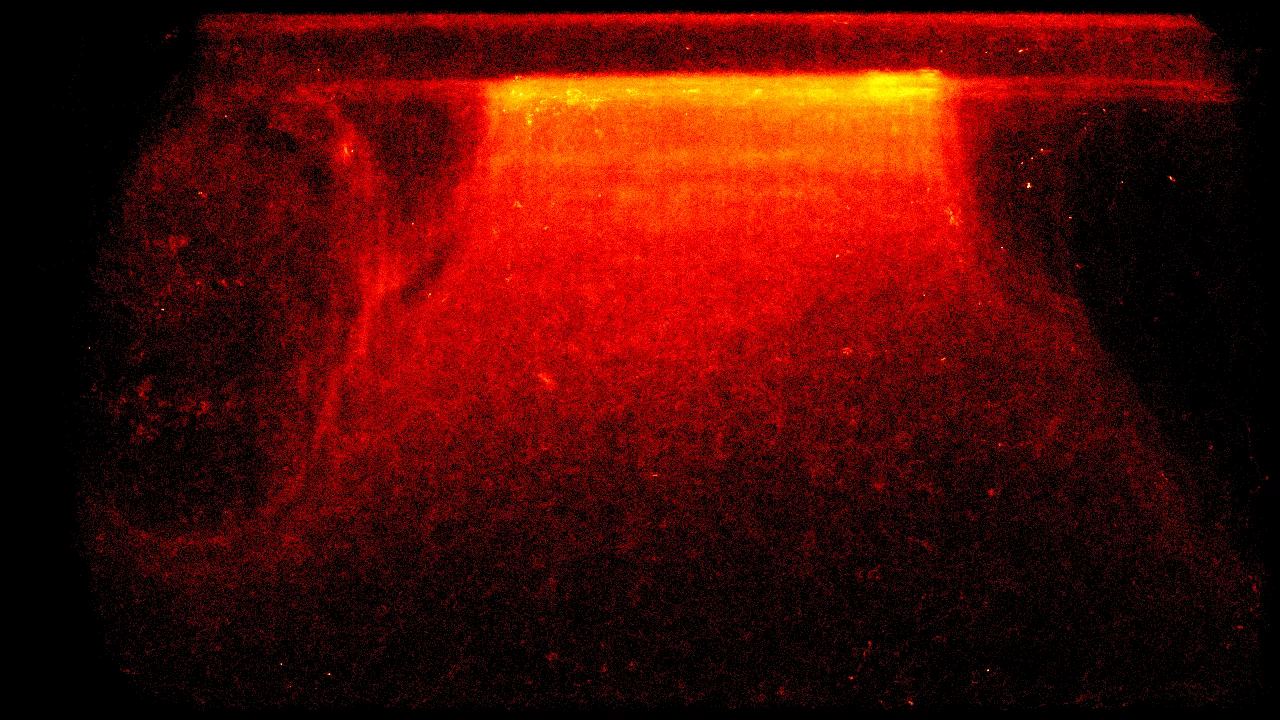
Generates daily visual heatmaps showing bee movement patterns and activity zones on the landing board to optimize hive entrance design and understand traffic flow.

🎭 User Story
- As a beekeeper interested in optimizing hive entrance efficiency
- I want to open the Entrance Observer section in hive details and switch from live view or recordings to heatmaps
- So that I can compare the most recent day by default and move to previous days when investigating traffic bottlenecks
🚀 Key Benefits
- Traffic optimization: Identify congested areas and potential improvements
- Entrance design insights: Data-driven approach to landing board modifications
- Long-term behavior analysis: Understanding of seasonal and daily patterns
- Research value: Visual data for studying bee traffic behavior
🔧 Technical Overview
Heatmap computation is owned by gate-video-stream, not the edge entrance-observer device.
entrance-observer still detects bees and keeps local daily JSONL track history for debugging. After each analysis run it also sends the tracked coordinates to gate-video-stream with the box ID, timestamp, frame dimensions, and trackHistory. gate-video-stream aggregates those trajectories into a per-user, per-box, per-day high-resolution sparse pixel heat grid, renders a daily PNG heatmap at the original frame resolution, stores it in the same object-storage bucket pattern used by video recordings, and exposes it to the web app through GraphQL.
📋 Acceptance Criteria
entrance-observeruploads trajectory payloads to the video stream service after tracking analysisgate-video-streamcomputes and stores one cumulative heatmap per entrance and day- Stored heatmaps are addressable by URL similarly to stored video assets
- Web app Hive details > Entrance Observer has three tabs: live view, recordings, and heatmaps
- The heatmaps tab shows the latest available day by default
- Previous day, next day, and latest controls let the user navigate historical heatmaps
- Missing days show an empty state instead of failing the view
🚫 Out of Scope
- 3D visualization or depth analysis
- Weather correlation with traffic patterns
- Automated landing board design recommendations
- Replacing raw video recordings with heatmaps
🏗️ Implementation Approach
- Data input: Edge-generated track history coordinate arrays per track ID
- Transport: Authenticated REST upload from
entrance-observertogate-video-stream - Processing: Server-side per-pixel daily accumulation with logarithmic visual scaling, preserving fine details such as corner dwell and edge traffic
- Visualization: High-resolution PNG heatmap generated by
gate-video-stream - Storage: Object storage under the user and entrance camera namespace, plus a MySQL index row for day navigation
- Web app:
entranceHeatmapsGraphQL query powers the Hive details heatmap tab
📊 Success Metrics
- Accurate coordinate processing within frame boundaries (0 <= x < width, 0 <= y < height)
- Daily heatmap generated from uploaded trajectory batches
- Proper normalization and color mapping for visual interpretation
- Web app can open latest available heatmap without knowing the date in advance
- Historical navigation works across days that have or do not have generated heatmaps
💳 Availability
Landing board heatmaps are included in the Professional plan as part of Entrance Observer analytics.
🔗 Related Features
- 📈 Count bees coming in and out - on the edge
- 📊 Bee movement metric reporting
- 🎥 Video streaming via API
- Hive telemetry storage
📚 Resources & References

💬 Notes
The older local heatmap_generator.py script remains useful for offline debugging and backfills. Production heatmaps are generated centrally as high-resolution PNG images so the web app can show them next to live streams and stored video recordings without losing fine landing-board detail.