
Hardware products
Devices that collect data in the apiary and send it to the web app. All hardware is open source.
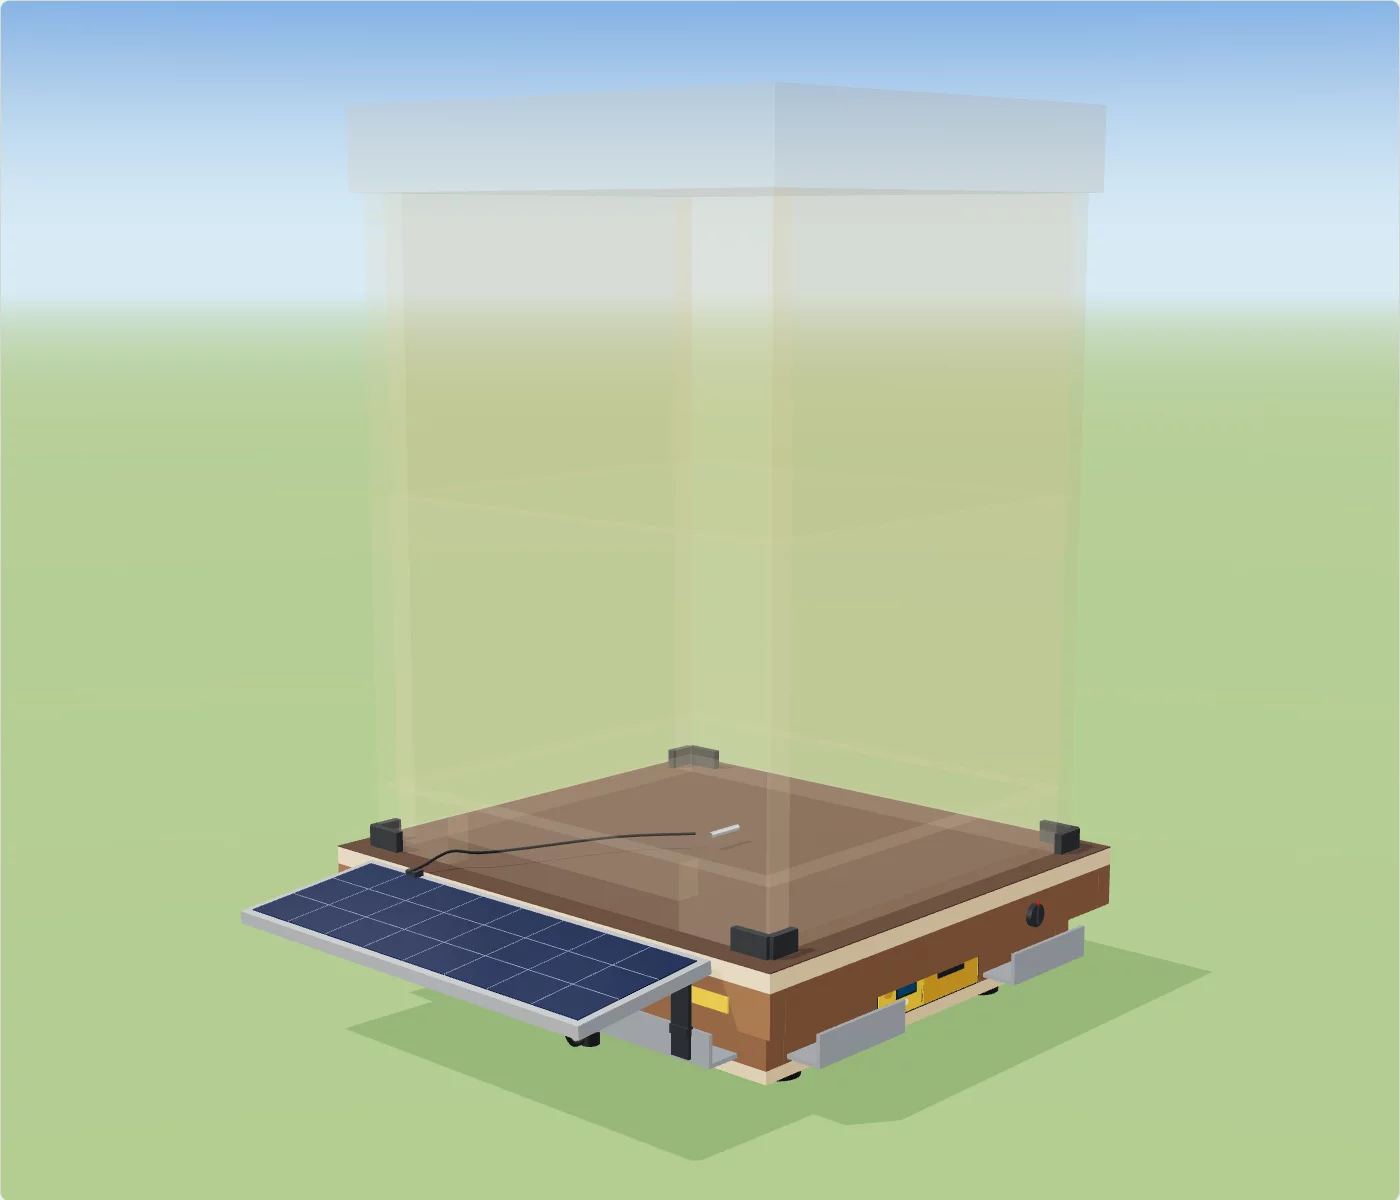
Beehive sensors
Weight, temperature, humidity, CO2, pressure and sound, to correlate colony development with the environment. The most affordable and energy-efficient device.
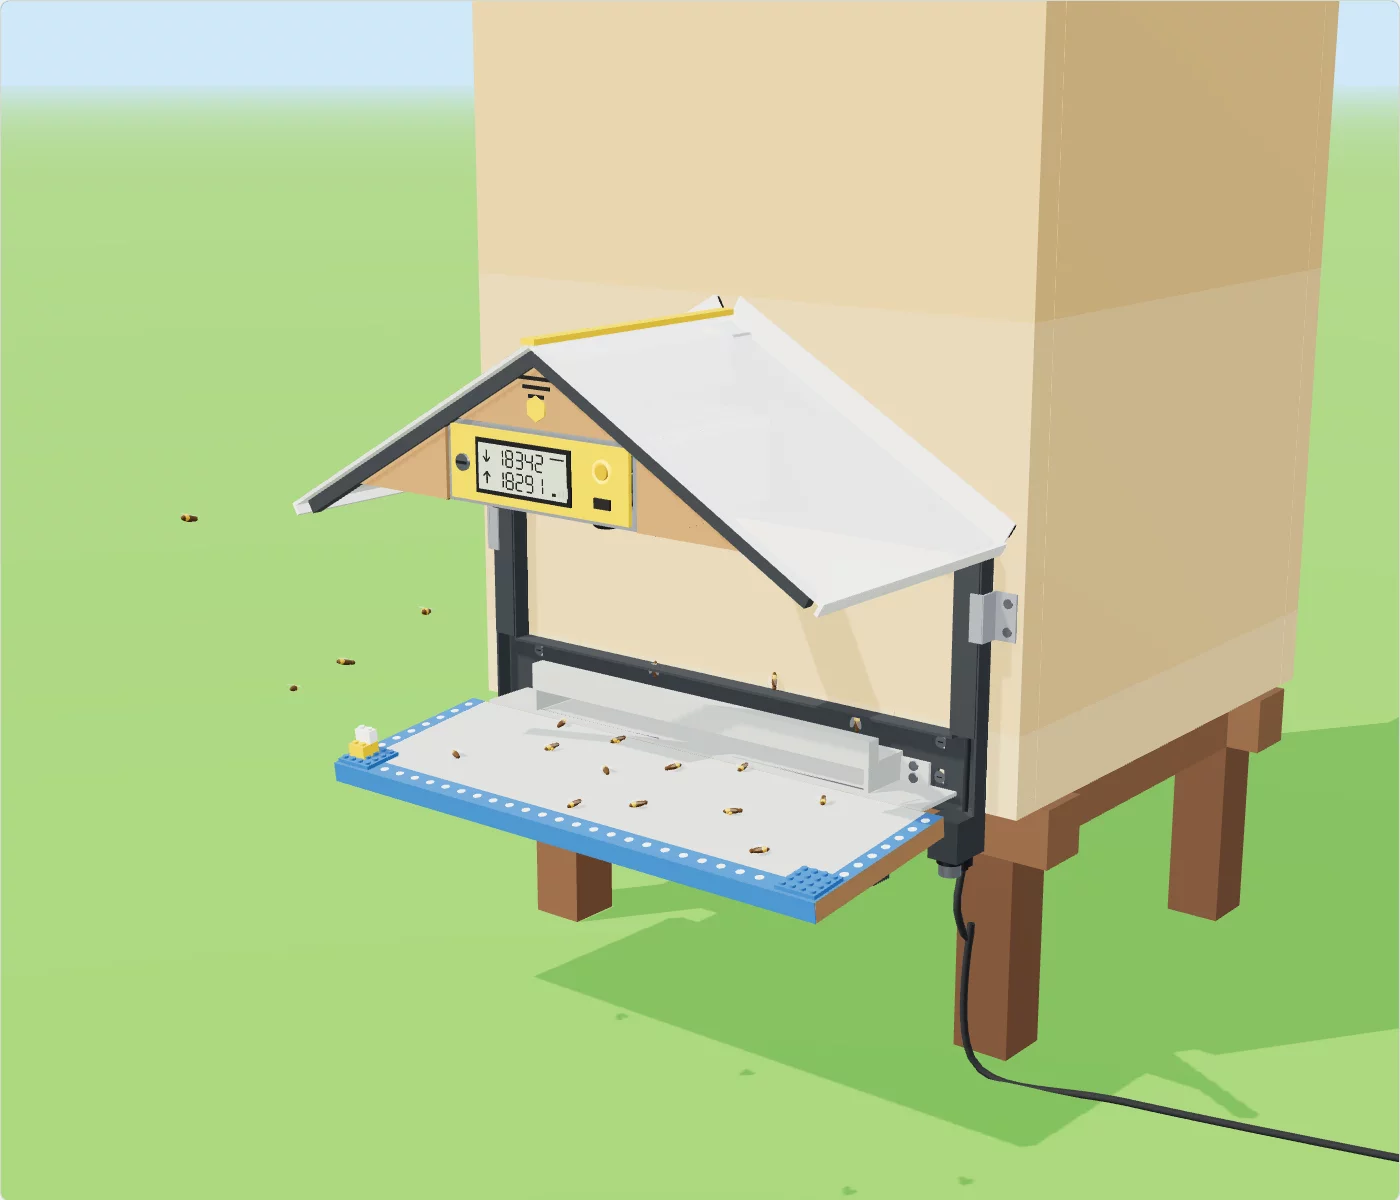
Entrance Observer
Live video of the hive entrance. Counts bees in and out, tracks pollen flow, and detects robbing, hornets and varroa on bees.

Robotic beehive
A cabinet that lifts frames one at a time and photographs both faces, without a beekeeper opening the hive. See the interactive 3D model.
Begin with the web app
The Gratheon web app is the shared workspace for hive records, inspections, uploaded photos, telemetry, alerts, and AI-assisted decisions. It is the first product most users need, even before they add field devices.
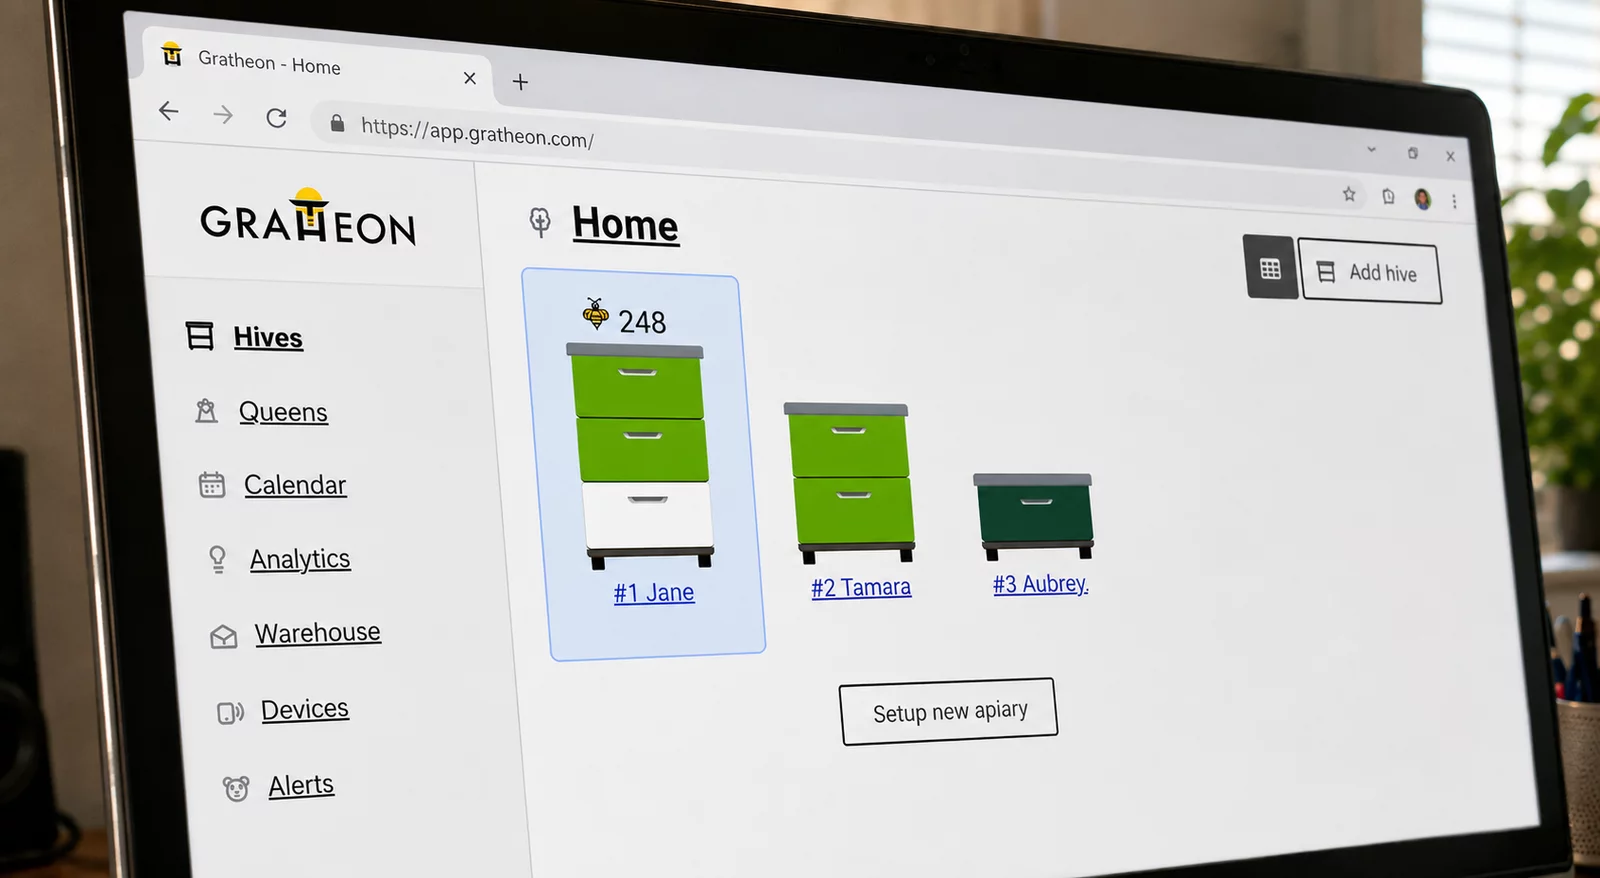
Start in the apiary
- Feeding history
- Live Queen Finder
Record inspections
- Inspection management
- Honeycomb cell detection
- Bottom-board varroa counting
Manage colonies
- Apiary, hive, frame, and inventory management
- Queen and colony operations
- Plant and placement planning
Analyze at scale
- Telemetry storage and analytics
- Cloud bee counting
- Colony comparison and alerts
Connect live devices
- Video playback
- Configurable alerts
How the system fits together
-
1
Model the apiary
Keep apiaries, hives, boxes, frames, inspections, treatments, and queen history structured enough for later analysis.
-
2
Collect visual and sensor signals
Frame photos, bottom-board images, entrance video, weight, temperature, humidity, and movement metrics create a richer colony picture.
-
3
Turn data into action
Computer vision, timeseries analytics, alerts, and AI suggestions help decide when to inspect, treat, feed, split, or wait.