
🛣️ Landing board heatmap generation
🛣️ Landing board heatmap generation
🎯 Purpose
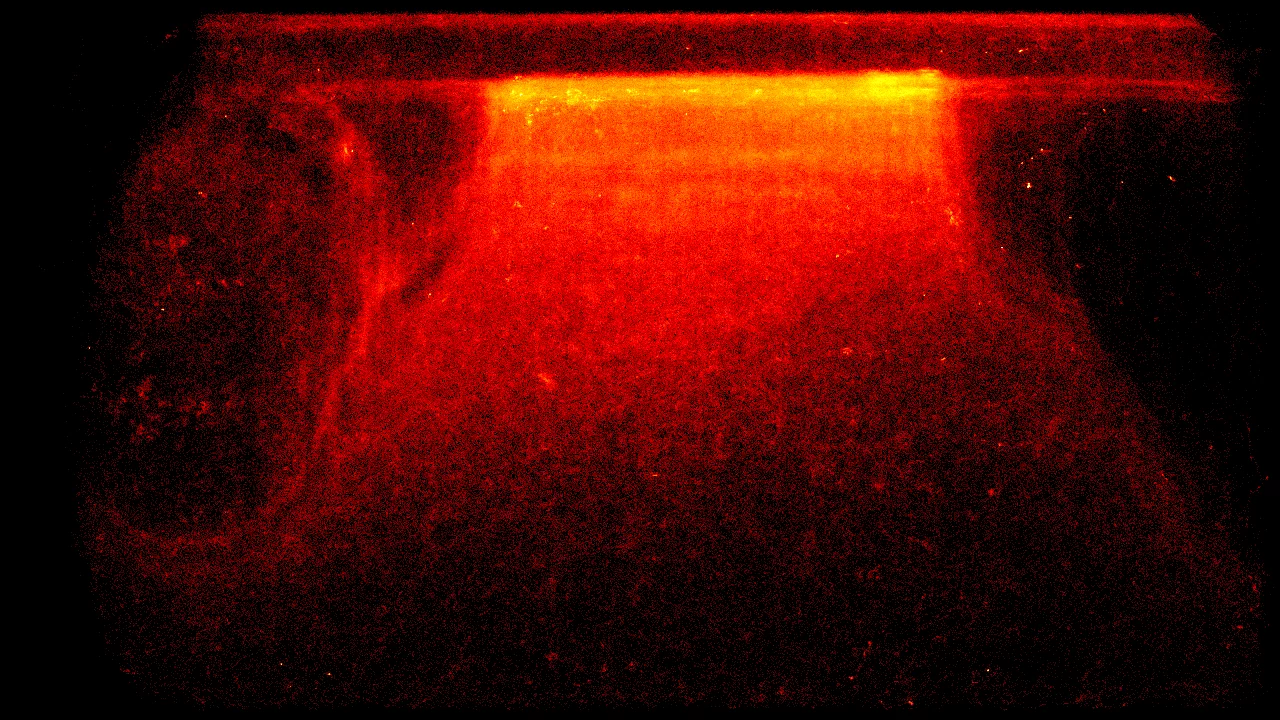
Generates visual heatmaps showing bee movement patterns and activity zones on the landing board to optimize hive entrance design and understand traffic flow.

🎭 User Story
- As a beekeeper interested in optimizing hive entrance efficiency
- I want to see where bees spend most of their time on the landing board
- So that I can identify traffic bottlenecks and potentially redesign the entrance for better bee flow
🚀 Key Benefits
- Traffic optimization: Identify congested areas and potential improvements
- Entrance design insights: Data-driven approach to landing board modifications
- Long-term behavior analysis: Understanding of seasonal and daily patterns
- Research value: Visual data for studying bee traffic behavior
🔧 Technical Overview
Processes track history data from daily-rotated JSONL files (track_history_YYYY-MM-DD.jsonl) using NumPy to generate density maps. The heatmap_generator.py script aggregates bee position coordinates into a 2D heatmap array with frame dimensions (1280x720), normalizes the data, and applies color mapping for visualization.
📋 Acceptance Criteria
- Processes track history from JSONL files with frame dimensions metadata
- Generates heatmaps for 1280x720 frame resolution
- Accumulates position data across multiple track files for temporal analysis
- Applies Gaussian blur and color mapping for visual clarity
- Exports heatmap images in standard image formats (PNG/JPG)
- Handles coordinate bounds checking for frame boundaries
- Supports batch processing of multiple days of data
🚫 Out of Scope
- Real-time heatmap generation (batch processing only)
- 3D visualization or depth analysis
- Weather correlation with traffic patterns
- Automated landing board design recommendations
🏗️ Implementation Approach
- Data Input: Track history JSONL files with coordinate arrays per track ID
- Processing: NumPy array accumulation of position frequencies
- Visualization: OpenCV and matplotlib for color mapping and blur effects
- Storage: Frame dimensions extracted from metadata in JSONL files
- Batch Processing: Command-line script for processing historical data
📊 Success Metrics
- Accurate coordinate processing within frame boundaries (0 <= x < width, 0 <= y < height)
- Heatmap generation from multiple JSONL track files
- Proper normalization and color mapping for visual interpretation
- Batch processing capability for historical data analysis
- File format compatibility for integration with web interfaces
🔗 Related Features
- 📈 Count bees coming in and out - on the edge
- 📊 Bee movement metric reporting
- 👭 Bee interaction detection
📚 Resources & References

💬 Notes
Actual implementation using NumPy for position aggregation and OpenCV for visualization. Processes real track history data saved by the telemetry system to generate traffic flow insights.