Final Garage48 project page
Problem
Food security. 735.1M undernourished people worldwide according to FAO in 2022
Farming crops are inefficiently pollinated. This happens because beehives are currently positioned randomly, however beekeeper decides to. Beekeepers do not know where and why to place beehives. Bees are key to natural pollination, which increases crop yields, aiding in food supply, reducing the need in deforestation. Farmers can inadvertently kill bees with pesticides.
Solution
We're improving environment overview for the beekeepers.
By analyzing pollination coverage from satellite, beehives can be positioned more efficiently.
Thanks to our app, farmers can get better yields, beekeepers get more honey and healthy bees and bees get more nectar or pollen diversity.
Diverse pollen improves bee's health as well as taste of the honey. Bees also do not need to compete with each other as much over resources. Separate hive positioning reduces the risk of diseases.
In general, Gratheon helps beekeepers with observability and automation so that they could be more efficient and their colonies would stay healthy. We provide app and integrate hardware so that computer vision could alert a beekeeper in case of danger. Our long-term vision is autonomous robotic beehive.
Pollen map feature ideation
1. Given a satellite image of the apiary with 5 km radius (max flight range of a bee), run AI predictions to detect which types of trees and field crops are growing around the apiary and its square area (m2).
Crop classification, image and feature by EOS data analytics as a goal
2. Given detected pollination sources, suggest to beekeeper how to optimally place bees to optimize for max nectar flow or max pollen diversity. This is also important given that crops may bloom at different time. Coupled with real-time pollination activity data at individual beehives, beekeeper can make informed decisions
Hive placement optimization, image and feature by beehero.io
Note that this feature targets beekeepers that are able to move beehives or city planners that want to optimally position autonomous beehives in the city. For static apiaries we would only provide what type of nectar/honey you can expect, so that you would know at which time specific nectar (ex. buckwheat) is harvested as well as predict the amount of honey depending on the plant's nectar secretion
Product Design Mockup
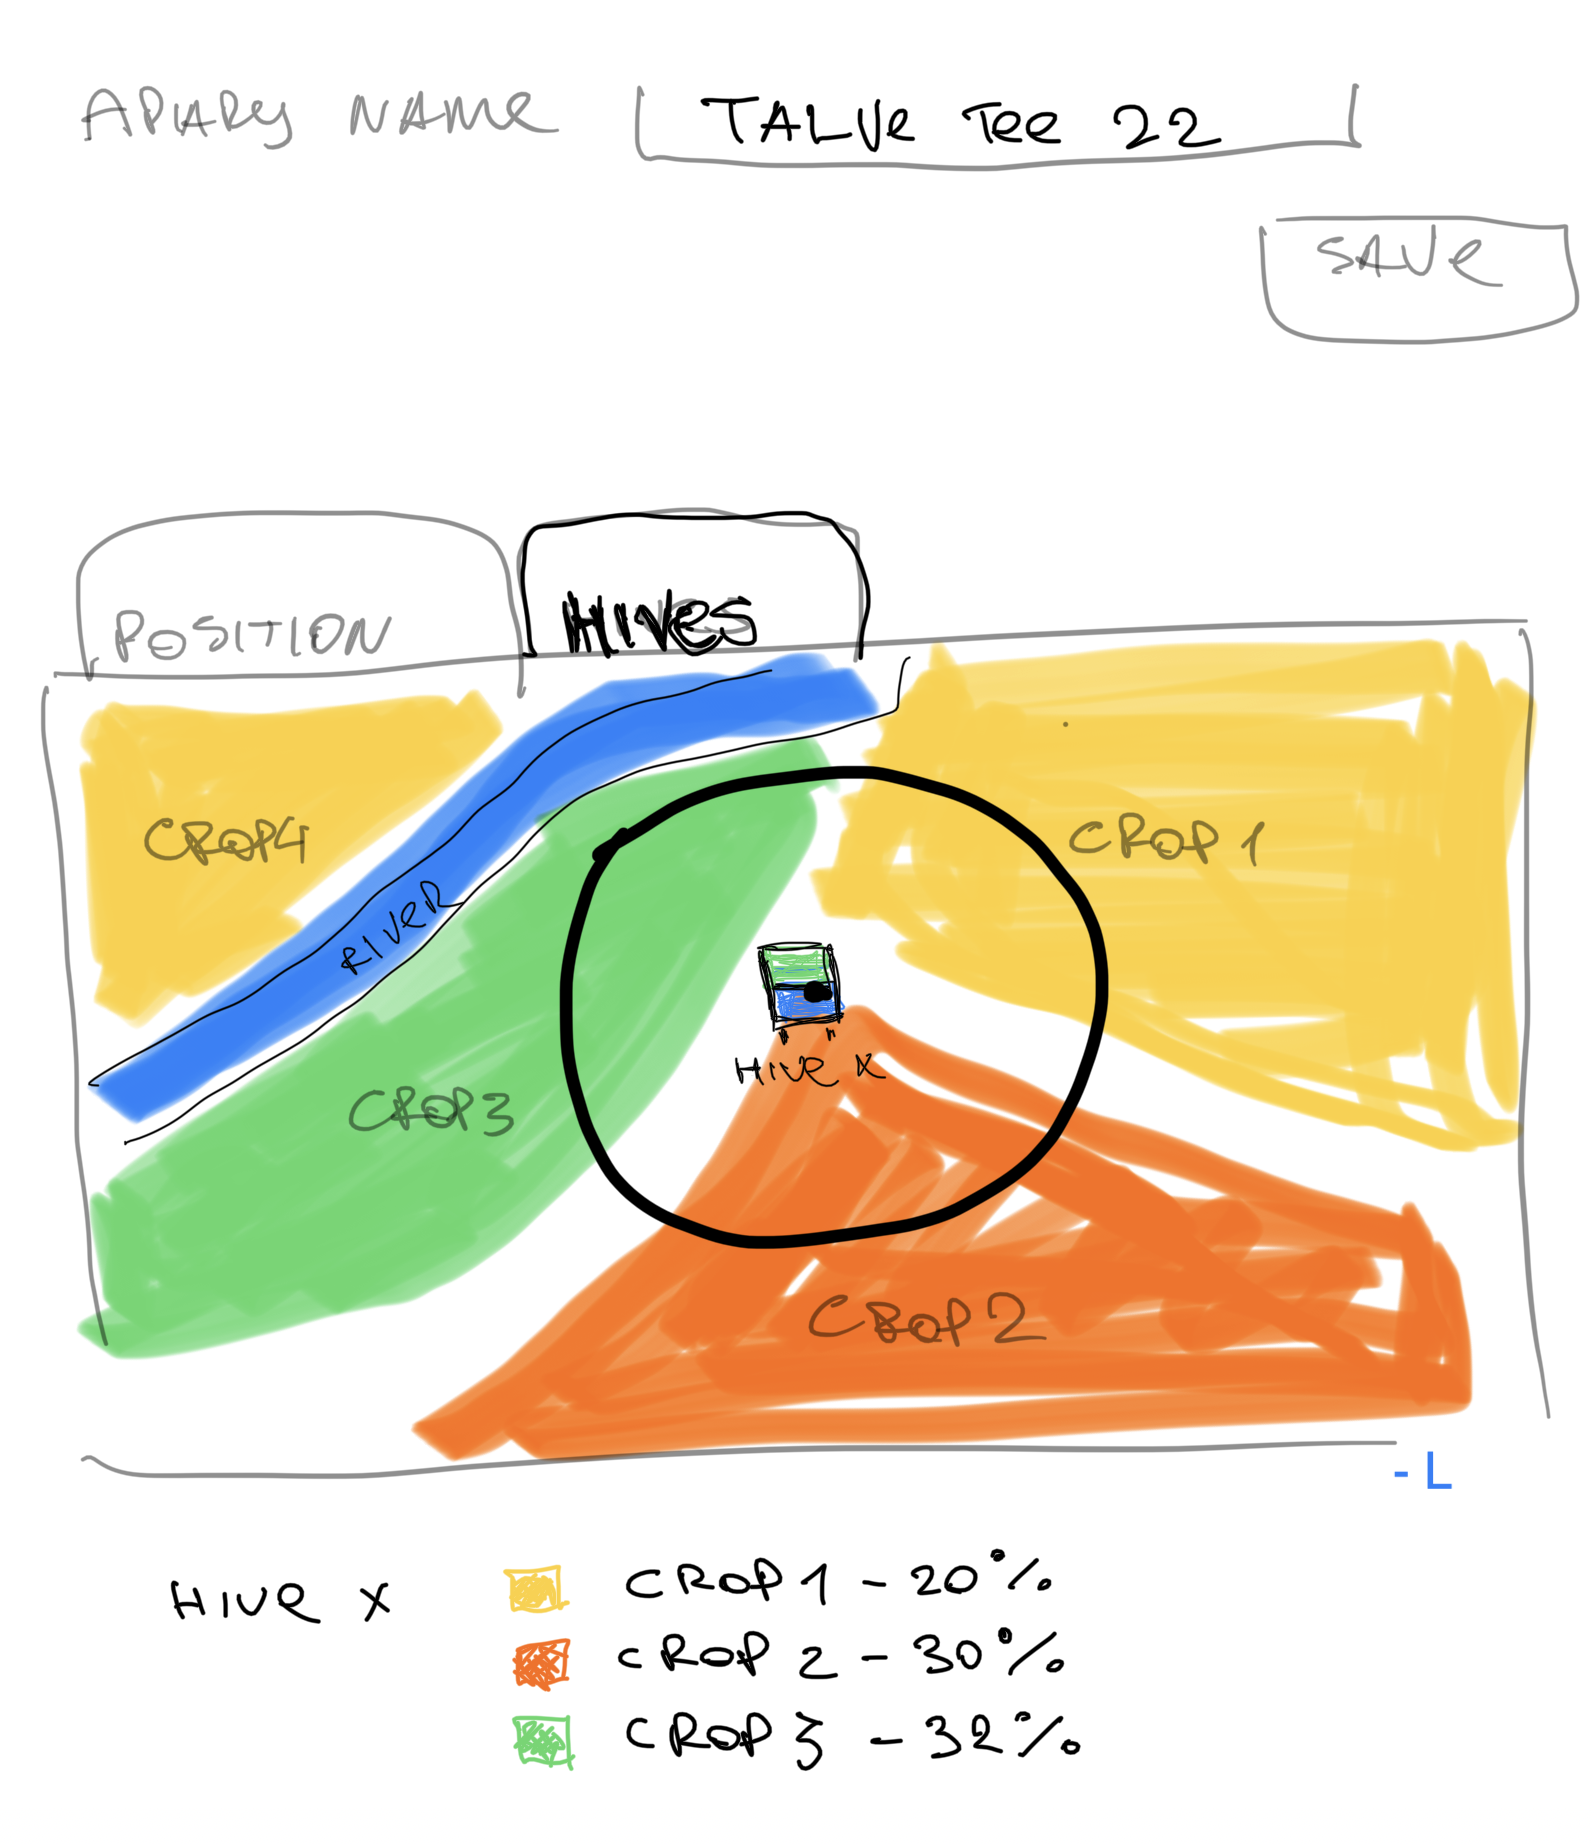
We started with how we want user to interact with the map to receive interested data
- crop types
- ratios of crops within pollinateable area
- blooming time
- plant nectar production (kg/ha)
EU space technologies
We are using Sentinel 2 L1C data, RGB layer to get base information about fields
We are then running segmentation on an image to detect fields
Then we run classification of detected fields to understand which crop we are dealing with. As we know time of the image, we can use it to match blooming time.
Then we calculate the square area of the field
Then we calculate the ratio of all field types within 5km vicinity and report this to the user (beekeeper)
Beekeeper can move the location of the beehive, which will result in recalculation of percentages
Beekeeper can also see how much bees from different hives intersect
Team
Artjom Kurapov - software engineer
Aleksei Boris - bizdev / legal / ops
Natalia Kinash - machine learning engineer, applied mathematics
Reinis Indans - GIS / fullstack engineer
Advisors-db
| Name | Area | Relevant org | Source | 🛴 Features |
|---|---|---|---|---|
| Olga Gerassimova | devopsops | pipedrive | ||
| Olena Stoliarova | engineering | climathon | ||
| Aleksei Kolesnikov | ops | tehnopol | ||
| Olga Shatokha | hiring | Bee’s Knees | pipedrive | |
| Evgeny Goroshko | devops | pipedrive | ||
| Archil Kristinashvili | monitoring | pipedrive | ||
| Martin Koidu | beekeepingproduct | pipedrive | ||
| Dmitri Don | beekeepingproduct | |||
| Dmitri Kalinaichev | beekeepingproduct | |||
| Vadim Shabarov | beekeepingproduct | |||
| Ernest Bondarenko | ethics | devclub | ||
| Ksenia Kravtšenko | legal | tehnopol | ||
| Oleg Tsernetsov | engineering | |||
| Ain Valtin | engineering | pipedrive | ||
| Anton Vishnevski | devopsengineering | climathon | ||
| Jevgeni Kalbin | robotics | tehnopol | ||
| Ilya Bolkhovsky | product | Kodebusters | cassini | |
| Marko Junolainen | beekeepingproduct | |||
| Anna-Maria Ouertani | press | Kanal 7 | postimees | |
| Jevgenia Parv | press | Delfi | delfi | |
| Sofia Spegatta | contractors / outsource | Solveit | linkedinstartup-day | |
| Annimari Lehtomäki | accelerator | JAMK | startup-day | |
| Olga Kurdovskaja | accelerator | Tehnopol Startup Incubator | tehnopol | |
| Julia Jolkin | hiring | devclub | ||
| Brait Pilvik | accelerator | Prototron | ||
| Liis Leidsaar | educationhiring | kood/Jõhvi | ||
| Khrystyna Hladun | gispotential-partners | EOS Data | ||
| Šimon Bilík | research | Brno University | ||
| Adam Ligocki | research | Brno University | ||
| Beatriz Remeseiro | research | Universidad de Oviedo | ||
| Erki Naumanis | beekeepingproduct | |||
| Anu Maasik | legalpatents | Moosedog | prototron | |
| Kati Pino | legal | Hedman | prototron | |
| Sergei Kaskov | ♻️Share of beehive inspection public URL | |||
| Ragmar Saksing | beekeepingpotential-partners | TalTech / Tehnopol | latitude59 |
Design mockup

System design
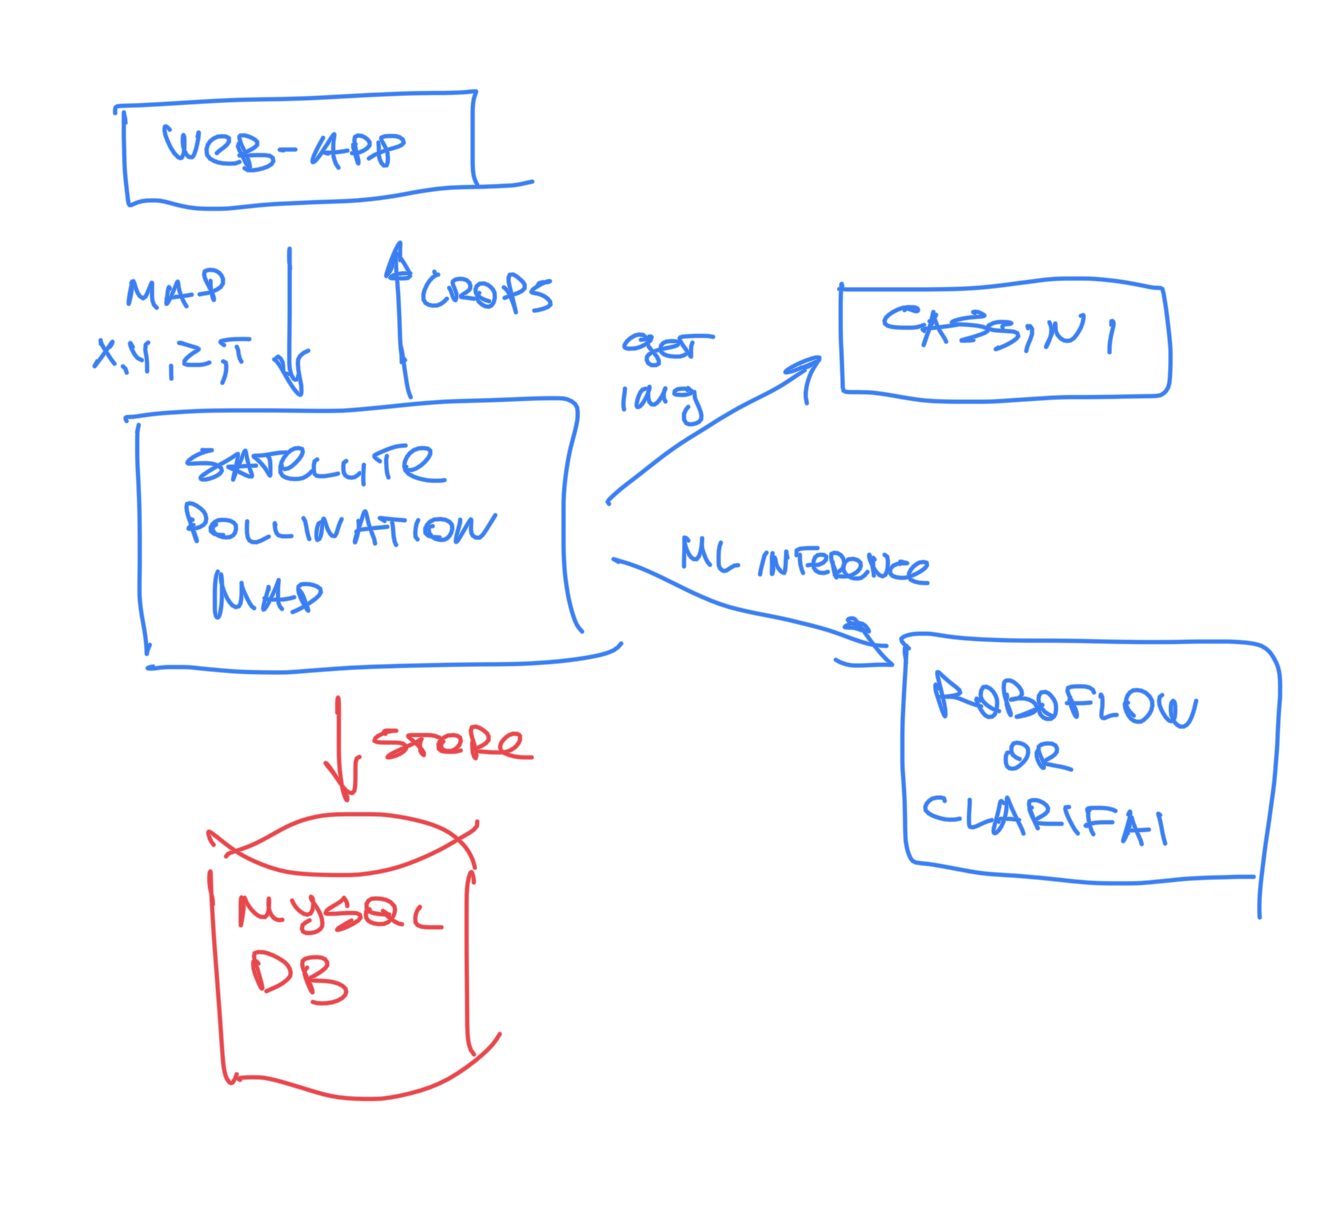
Initial idea was that, given coordinates X,Y of the apiary, we make request to copernicus servers to receive RGB visible spectrum data. Then we pass result png image to a trained ML model that will do segmentation of fields and classification of them. We then wanted to store inference results to DB to have caching in place in case user visits same page.
Machine learning and SATELLITE DATA USED
We trained two separate models during development.
We tried first a light-weight version which could do segmentation of fields without actual classification. We did not end up using it as we wanted actual field types and it was trained on pre-existing dataset that was not related to Copernicus although it would be the fastest to integrate
Second model was more complex. We exported map of Estonia without cloud coverage (for 13 june 2023) from Copernicus Open Data Hub in multispectral .dim format which includes all layers (infrered etc), then we processed it in QGIS. We normalized resolution to be 20m.
For training a model we took polygon data from Estonian registries - PRIA (crop fields registry) and Maaamet (forests and buildings). Then we unified these layers, cleaned classes (out of original 300 classes we got 25 classes). To prepare dataset, for every class we picked training (300) and validation(50) instances. We used random forest model.
QGis interface
As a result, model produces an image where for every pixel we have a class prediction. This allows us to run inference in countries/regions that do not have digital field/crop mapping data available. This also allows us to easily calculate class ratios using simple per-pixel sumation.
For inference we use sentinel-2-l2a and process API
Visualization of trained field classification near Tallinn, Estonia (on top)
Result app
We have a web-app deployed and available for the customers.
We make request to copernicus server to get sentinel-2-l2a image for specific location +- 4 km (bee flight range) and provide a list of classes we can run inference on
To access it, you need to:
- register in the app - https://app.gratheon.com/account/register
- create new apiary - https://app.gratheon.com/apiaries/create
- go into apiary view, drag the marker and click "Analyze crops" - https://app.gratheon.com/apiaries/edit/2
Source code
- ML training dataset - https://drive.google.com/drive/folders/1Gh4DXqaDFF1r3lsgxQlo2HREPjo6xlRK?usp=sharing
- Backend & ML code - https://github.com/Gratheon/satellite-pollination-map
- Frontend recent changes related to hackathon - https://github.com/Gratheon/web-app/commits/main
Limitations & future work
- We could connect beekeepers with farmers to prevent pesticide exposure affecting bees during blooming time
- ML model needs more work on precision. We used fixed date for dataset, so instead we could use historical data to train models with more precise blooming time (say every 2 weeks, april-june)
- We did not reach deploying model into production within hackathon timeframe.
- We did not reach integrating correct pollination times and nectar flow rate for classes that we intend to detect